Could Ripple's Upward Momentum Continue ? XRP Surges while Bitcoin and Ether Retrace
Ripple(XRP) is currently the seventh-leading cryptocurrency with a market cap of around $21,391,909,521. It is trading at $0.475 at the time of writing.

Ripple (XRP), the digital token created by Ripple Labs Inc., is currently the seventh-leading cryptocurrency with a market cap of around $21,391,909,521. It is trading at $0.475 at the time of writing.

After Bitcoin strongly broke through numerous resistances, reaching an all-time high of $61,781, it corrected by around 10%. Other well-known cryptocurrencies such as Ethereum (ETH), Chainlink (LINK), and Litecoin (LTC), have suffered various degrees of losses. However, XRP outperformed Bitcoin and other major cryptocurrencies on March 16 with an over 9% increase.
XRP’s MACD indicator is close to the state of cohesion and Stochastic RSI has formed a "golden crossover" – a bullish indicator on the price chart. So what will the next trend of the XRP/USD be?
Ripple (XRP) Price Analysis
Source:XRP/USD Daily via TradingView
Bitcoin has performed strongly in the past two weeks and broke through numerous resistances, reaching a maximum of $61K. However, in the past two weeks, the performance of Ripple (XRP) has not been very impressive as the token has been hovering around $0.40 to $0.50.
But there seems to be a phenomenon suggesting that XRP will usher in a new dawn, with the price of XRP rising by 9.07% in the past 24 hours. Yesterday, the bulls were strong and pushed the price to the level of $0.52. However, it seems that many short-term traders are eager to sell to cash out, thus forming strong selling pressure and pushing the price down to the closing price of $0.468. An inverted green hammer candlestick has been formed, suggesting that XRP's bullish situation may soon be reversed.
At the time of writing, the XRP price is hovering at a level of $0.47. The price is still above the Exponential Moving Average(EMA) ribbon. The technical chart shows that as long as the XRP bulls can stay above the 20-day EMA, which is about $0.46, XRP's uptrend will continue. Buyers will also need to push the price above the important $0.50 to unlock a new upside potential.
On the contrary, if XRP/USD falls, XRP's price will be pushed down to the first support level of $0.415. However, this horizontal support line is not strong enough, which means that if XRP/USD falls, the currency pair may likely fall to the key support area of $0.37.
From a technical perspective, the stochastic RSI indicator rebounded quickly after touching the 20 oversold mark. The blue K-line exceeded the yellow D-line and formed a bullish crossover. Both lines have turned upwards, which may make it difficult for the bears to initiate a downward breakdown.
If the bulls can actively defend the rally near yesterday's intraday high so that the two lines can climb to the 50 point mark, the new momentum may push XRP to the first resistance at $0.566. If XRP/USD successfully breaks through this resistance, the bulls will set the target price at $0.6400 and any further increase will likely make XRP/USD hit its all-time high of $0.79.
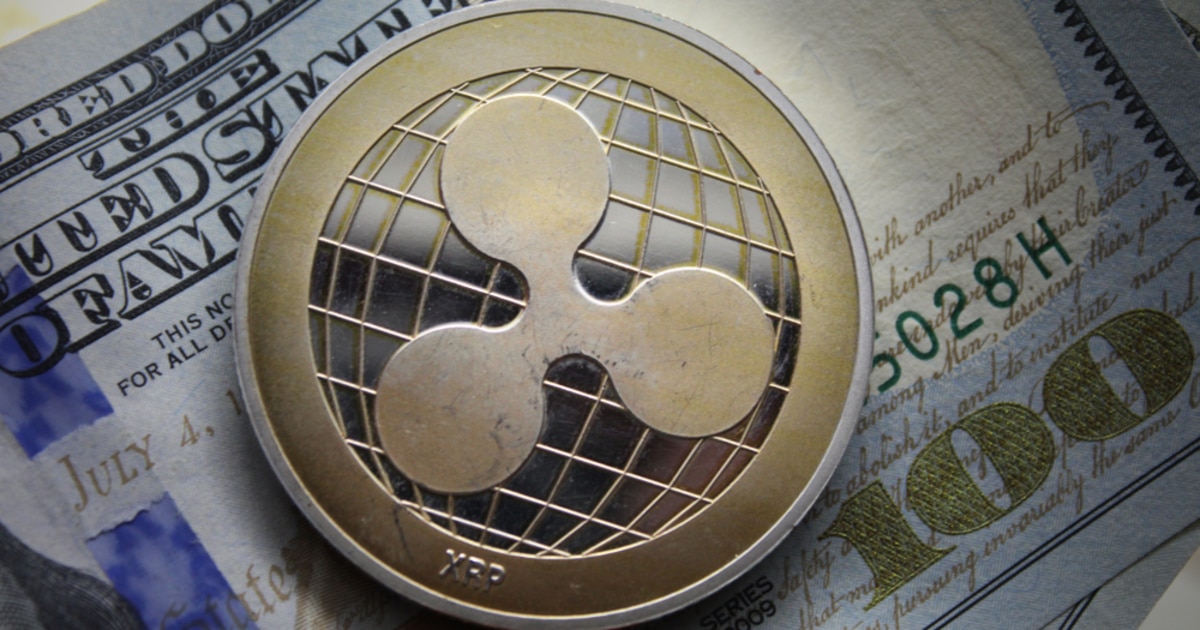
Image source: Shutterstock


.jpg)
