Lead
APP
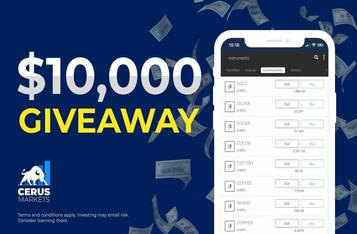
Cerus Markets Launches its Mobile Trading App $10,000 Giveaway
Cerus Markets is excited to launch its Mobile Trading App Giveaway!
Stocks
Mobile advertising and its machine-learning bidding engine.
Market data uses cached snapshots: prices refresh after 15 minutes, company details after 24 hours, and financials and corporate actions after 12 hours. Prices are completed-session closes, not live quotes.
Price snapshot retrieved . This is the retrieval time, not the trading-session time.
Some market snapshots are awaiting refresh or the provider is unavailable. Figures may be out of date; check the dates before using them.
AppLovin is a vertically integrated advertising technology company that serves as a demand-side platform for advertisers, a supply-side platform for publishers, and an exchange that facilitates transactions between the two. About 80% of AppLovin's revenue comes from the DSP, AppDiscovery, while the remainder comes from the SSP, Max. AppLovin's primary tool for future growth is Axon 2, an ad optimizer within the DSP that lets advertisers place ads based on specified return thresholds.
AppLovin websiteDaily open, high, low and close with volume.
Quotes are delayed at least 15 minutes.
Computed daily from APP's own price history — not third-party ratings. Technical analysis describes past price behaviour; it is information, not investment advice.
Based on APP's high/low over the same history as the chart above.
Quarterly highlights and original SEC reports
Verified annual USD facts from SEC filings. Collected .
| Annual period | Revenue | Cash capex | Productive asset purchases | Operating cash flow | Free cash flow | R&D | R&D / revenue |
|---|---|---|---|---|---|---|---|
| to | $5.48 billion | Not available | Not available | $3.97 billion | Not available | $226.51 million | 4.1% |
|
RevenueFromContractWithCustomerExcludingAssessedTax · 10-K filed · accession 0001751008-26-000010
NetCashProvidedByUsedInOperatingActivities · 10-K filed · accession 0001751008-26-000010
ResearchAndDevelopmentExpense · 10-K filed · accession 0001751008-26-000010
|
|||||||
| to | $3.22 billion | $4.78 million | Not available | $2.1 billion | $2.09 billion | $374.71 million | 11.6% |
|
RevenueFromContractWithCustomerExcludingAssessedTax · 10-K filed · accession 0001751008-26-000010
NetCashProvidedByUsedInOperatingActivities · 10-K filed · accession 0001751008-26-000010
PaymentsToAcquirePropertyPlantAndEquipment · 10-K filed · accession 0001751008-25-000018
ResearchAndDevelopmentExpense · 10-K filed · accession 0001751008-26-000010
|
|||||||
| to | $1.84 billion | $4.25 million | Not available | $1.06 billion | $1.06 billion | $333.78 million | 18.1% |
|
RevenueFromContractWithCustomerExcludingAssessedTax · 10-K filed · accession 0001751008-26-000010
NetCashProvidedByUsedInOperatingActivities · 10-K filed · accession 0001751008-26-000010
PaymentsToAcquirePropertyPlantAndEquipment · 10-K filed · accession 0001751008-25-000018
ResearchAndDevelopmentExpense · 10-K filed · accession 0001751008-26-000010
|
|||||||
| to | $2.82 billion | $662,000 | Not available | $412.77 million | $412.11 million | $507.61 million | 18.0% |
|
RevenueFromContractWithCustomerExcludingAssessedTax · 10-K filed · accession 0001751008-25-000018
NetCashProvidedByUsedInOperatingActivities · 10-K filed · accession 0001751008-25-000018
PaymentsToAcquirePropertyPlantAndEquipment · 10-K filed · accession 0001751008-25-000018
ResearchAndDevelopmentExpense · 10-K filed · accession 0001751008-25-000018
|
|||||||
Source: the SEC Company Facts API, using standard US GAAP facts in USD from annual 10-K, 20-F or 40-F filings and amendments. Periods must span 300-400 days. Quarterly and year-to-date values are not presented as annual totals.
Company-specific extension tags, IFRS-only data and unsupported definitions are not estimated. Missing standard facts are shown as unavailable, not zero. Data is refreshed in the background; the collection time is separate from the filing date.
Compare reported revenue growth, profitability and valuation. Related companies can have different business models and fiscal calendars.
| Company | Latest close | Revenue growth (YoY) | Net margin (TTM) | P/E (TTM) | P/S (TTM) |
|---|---|---|---|---|---|
| AppLovin (APP) | $262.19 | — | — | — | — |
| Unity (U) | $41.40 | — | — | — | — |
| Meta Platforms (META) | $737.54 | — | — | — | — |
| Apple (AAPL) | $342.96 | — | — | — | — |
| Alphabet (GOOGL) | $347.64 | — | — | — | — |
Related companies are drawn from our coverage universe and may operate in different industries. Prices reflect the latest available market close.
Stock prices reflect the latest available market close. Market capitalisation and financial results may have different reporting dates; refer to the dates shown when comparing companies.
Theme membership is editorial, not an investment recommendation or a complete market universe. Compare similar business models and verify financial statements through the company website linked on each stock page.
Market-moving headlines mentioning AppLovin.
Cerus Markets is excited to launch its Mobile Trading App Giveaway!
AppLovin (APP) last closed at $262.19 on October 14, 2026. Quotes are delayed at least 15 minutes.
Over the past 52 weeks APP has traded between $261.00 and $738.01.
AppLovin has a market capitalisation of about $91.12 billion.
APP trades on NASDAQ, in the Services-Computer Programming, Data Processing, Etc. industry.
Blockchain.News publishes APP coverage and price forecasts on this page, with 6 stories filed so far. This is information, not investment advice.
APP's 14-day relative strength index (RSI) is 30.6, which is neutral on the standard 30/70 scale. RSI measures the speed of recent price moves, not a price target — this is not investment advice.
APP's 50-day moving average is currently below its 200-day moving average — a Death Cross (bearish long-term trend) in classic technical-analysis terms. Moving-average crossovers describe past price behaviour, not a forecast.
Coverage is for information only and is not investment advice. Stock prices can move quickly and past performance does not guarantee future results.
Quotes are delayed at least 15 minutes. Last updated .