Bitcoin Dips Below $50,000 as Price Correction Continues, What's Next?
Despite its price retracement, market analysts are still bullish on Bitcoin. What can we expect from the cryptocurrency in the upcoming days?

Bitcoin has been undergoing a continued price correction after hitting a new milestone of over $58,000. At the time of writing, it has once again dipped below the $50,000K mark.

Despite that, investors have remained bullish on Bitcoin, with Fidelity's Global Asset Allocation Director comparing the cryptocurrency to digital gold.
In a report, he submitted compelling arguments as to why Bitcoin was a better way to hedge against inflation than gold. He said:
"Seen as a form of digital gold, Bitcoin may act as a stable store of value and potentially offer protection against inflation- and even hyperinflation."
With Bitcoin retracing below $50,000, what can we expect from the cryptocurrency in the upcoming days?
BTC Price Analysis
With the fall in interest rates on U.S. 10-Year Treasury bonds and the House passing President Biden's $1.9 trillion stimulus bill, investors are no longer as panicked about rising interest rates and monetary tightening policies.
Bitcoin ushered in a new round of surges after hitting a previous low point of $43,021 on February 28. Currently, it is struggling to stay above the $50,000 mark.
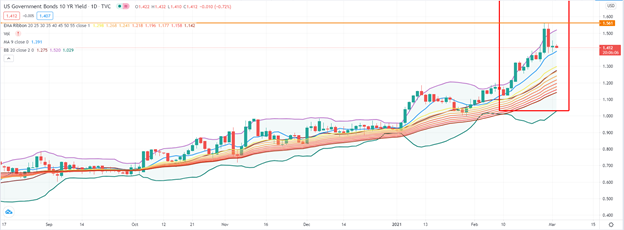
Source:US Government Bonds 10 YR Yield Daily via TradingView
Citi analyst team said that Bitcoin is at a "turning point", and it may become everyone's preferred international trade currency or face a "speculative implosion." In the report, Citigroup stated that Bitcoin "is at the tipping point of mainstream acceptance" after it recently gained popularity thanks to backing from companies such as Tesla and MasterCard. The bank said:
“Bitcoin’s future is thus still uncertain, but developments in the near term are likely to prove decisive as the currency balances at the tipping point of mainstream acceptance or a speculative implosion.”
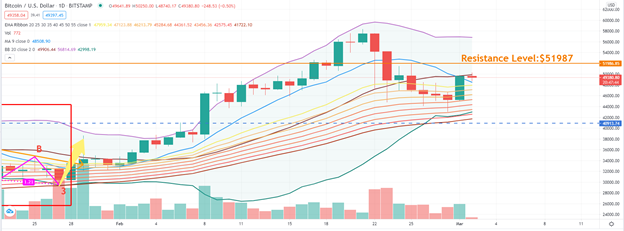
Source: BTC/USD Daily via TradingView
Judging from the daily candlestick chart, on March 1, the Bitcoin price crossed the Exponential Moving Average Ribbon through the 30-day Moving Average, and the 25-day Moving Average finally stood above the 20-day Moving Average- breaking through the $48,000 mark and approaching the $50,000 point. BTC/USD broke through the $50,000 mark at the highest point today, reaching $50,250. At the time of writing, the price of BTC has dropped and is currently trading at $49,358.
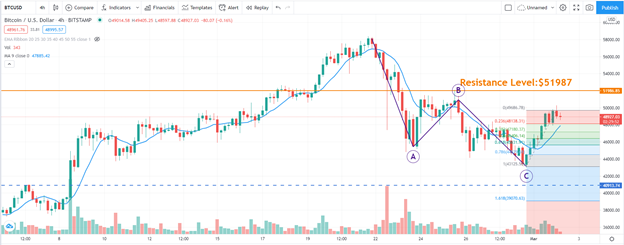
Source: BTC/USD 4-hour via TradingView
From the 4-hour candlesticks chart, after several days of highly volatile trading, BTC has stabilized. Although BTC has started a good wave of recovery, it does not mean that the callback is over.
According to the Elliott wave principle, as shown in the figure, the downward interval was due to three obvious corrective actions. Bitcoin started a decent rise above the resistance level of $48,000. The current price trend is above the EMA ribbon and the 9-day Moving Average. In the future, Bitcoin may face a strong seller-off between $51,000 and $52,000.
Currently, investors still need to pay attention to the pressure level. First, the first pressure level will be the high point of the previous down period (point B), which is about $51,987, and the second pressure level is marked at $58300.
Once this pullback is completed, BTC can then target $70,000. Before rising, BTC needs to break through and stabilize above the resistance levels of $51,900 and $58,300.
Image source: Shutterstock

.jpg)